While the NHL is the smallest of the Big 4 sports, it’s still a liquid market that is hard to beat at post. I’ve spent time working on an in-play hockey totals model, and as a result I’ve been thinking about how sharp the pre-game totals market is in general.
In order to assess the efficiency of the market, I used the Odds API to pull in pre-game total lines and prices from the available sportsbooks an hour before puck drop. I am using the 2022 and 2023 season, which is a sample of 2800 games. More data would be helpful to a certain degree, though the market tends towards efficiency and so using data from earlier years could provide misleading signals. To test efficiency, I used LowVig, which is an offshore site that many sharps use due to the lower vig, and it was the sharpest book available in this data set.
First, here’s a table of the average vig-free implied percentage for each of the common lines, along with the average goals scored in the game with each line.
| Line |
Avg Implied Prob (No Vig) |
Avg Observed Goals |
Variance of Observed Goals |
Number of Games |
| 5.5 |
51.6% |
5.8 |
5.1 |
582 |
| 6.0 |
51.8% |
6.2 |
5.4 |
864 |
| 6.5 |
51.9% |
6.5 |
5.2 |
833 |
| 7.0 |
48.2% |
6.8 |
5.8 |
74 |
As you can see, average goals scored by line are slightly higher than the line, aside from 7, which is what we would expect to see given that the implied probability of the over is slightly above 50%.
Now let’s look at the distributions. While the mean line could be sharp, there’s opportunities to bet on the alternative lines, and so it’s important to be well calibrated. To test that, for each total, I plotted the histogram of totals, and then overlayed the theoretical Poisson distribution, with lambda equal to the line. Given that the mean is approximately equal to the variance for hockey goal totals, I felt comfortable using the Poisson distribution, though a negative binomial distribution may fit the data slightly better.
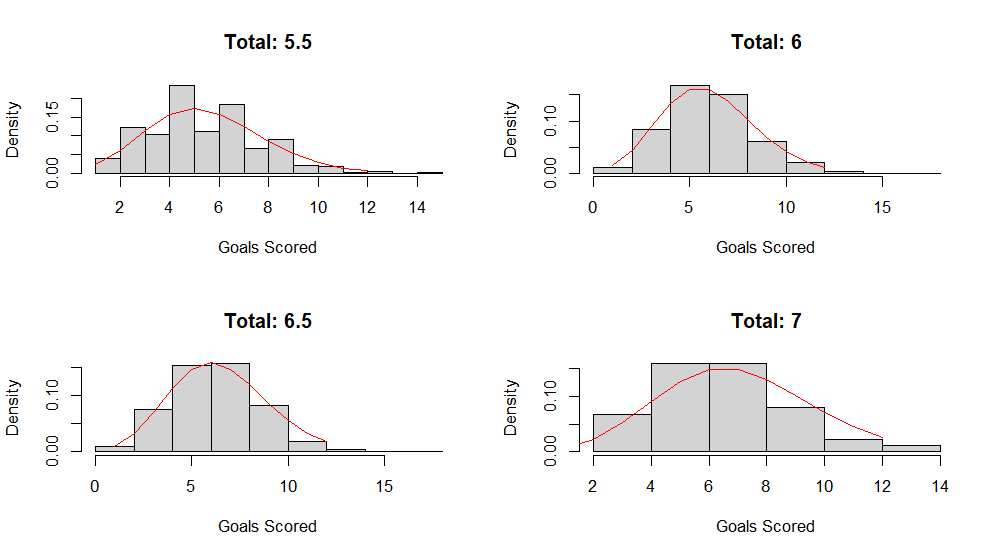
Aside from the 5.5 total, the theoretical distribution fits the observed data well. Given that the sample size is smaller for 5.5 than it is for 6 and 6, I’m guessing that if there were more games lined at 5.5, the observed data would start to converge to the theoretical distribution. Still, it’s something to look into closer. From this though, the Poisson distribution using the game total as lambda fits the data pretty well, and if there are alternative totals being offered at prices that are far off from this distribution, it’s definitely worth looking into.
In summary, unsurprisingly, the NHL totals market is pretty sharp. This isn’t an amateur hour market and real work is required in order to beat it. An area that I think potentially could be fruitful is in the alternative markets, where a certain effect might not change the mean projection, but could change the variance and make certain alternative numbers more appealing. These markets tend to have higher vig though (at least on DraftKings), making the hurdle higher to overcome.