Deciding when an organization should promote a player is a difficult decision. For one, there are many factors outside of the individual player’s control. For example, the positional depth at their position in the organization can impact the playing time available. Often times it doesn’t matter how well a player has performed, if the player above them is also performing well they have to stay at the lower level until the log jam is resolved. The other challenging part is that it’s difficult to say when a player has actually improved. Although there are pitch level stats, like Stuff+, that stabilize quickly and provide a good idea for how a pitcher’s stuff might play at the big-league level, that’s not the case for every stat. If we are looking at a results-based stat on a rolling basis (say K%), it’s hard to tell if a player has actually gotten better or worse — or if it’s just noise.
To better understand if player skill has actually changed, I’ve started using a technique called Bayesian Online Changepoint Detection. This technique allows us to produce estimates from time series data to detect when the underlying skill level has changed. In today’s article, I wanted to show how I’ve been using this and how the process works.
First, let’s start with a basic primer on change point analysis. The goal of change point analysis is to estimate when there has been a significant shift in the underlying data generating process. The specific algorithm I used is called Bayesian Online Changepoint Detection (BOCD for short), which gives probabilistic estimates as to when the underlying parameters of a generative process change. In simpler terms, if you are running a business that sells books, and in the previous month you average 10 books a day, and then sales pick up and you start selling 15, BOCD will say when the underlying time series shifted from 10 to 15.
This algorithm is Bayesian in nature, so it gives probabilistic estimates as to when the change point actually occurs. These are also considered to be “online” estimates, meaning that the algorithm is determining in “real-time” when a change point exists. This is useful in the context of player evaluation and determining when a team might want to promote a player, because it gives real-time estimates of changes in skill. The algorithm isn’t foolproof and so there are chances of false positives, which could lead to promoting a player too quickly, but no model is perfect and it’s important to have a way to analytically look at changes in skill.
Let’s look at a few specific examples. I’m going to use rolling 15-game strikeout rate as my time series here, and I’m going to look at a few power hitting prospects with high strikeout rates, and then used BOCD to help inform if I think this hitter should be promoted. I chose this example specifically because while power is something that is fairly obvious to pick up on, change in strikeout ability is a bit trickier to notice and having a model for picking up changes in skill is helpful. It can be tempting to see a small sample where strikeout rate decreases and say that he’s improved, but BOCD should be able to more accurately detect a shift in underlying strikeout rate.
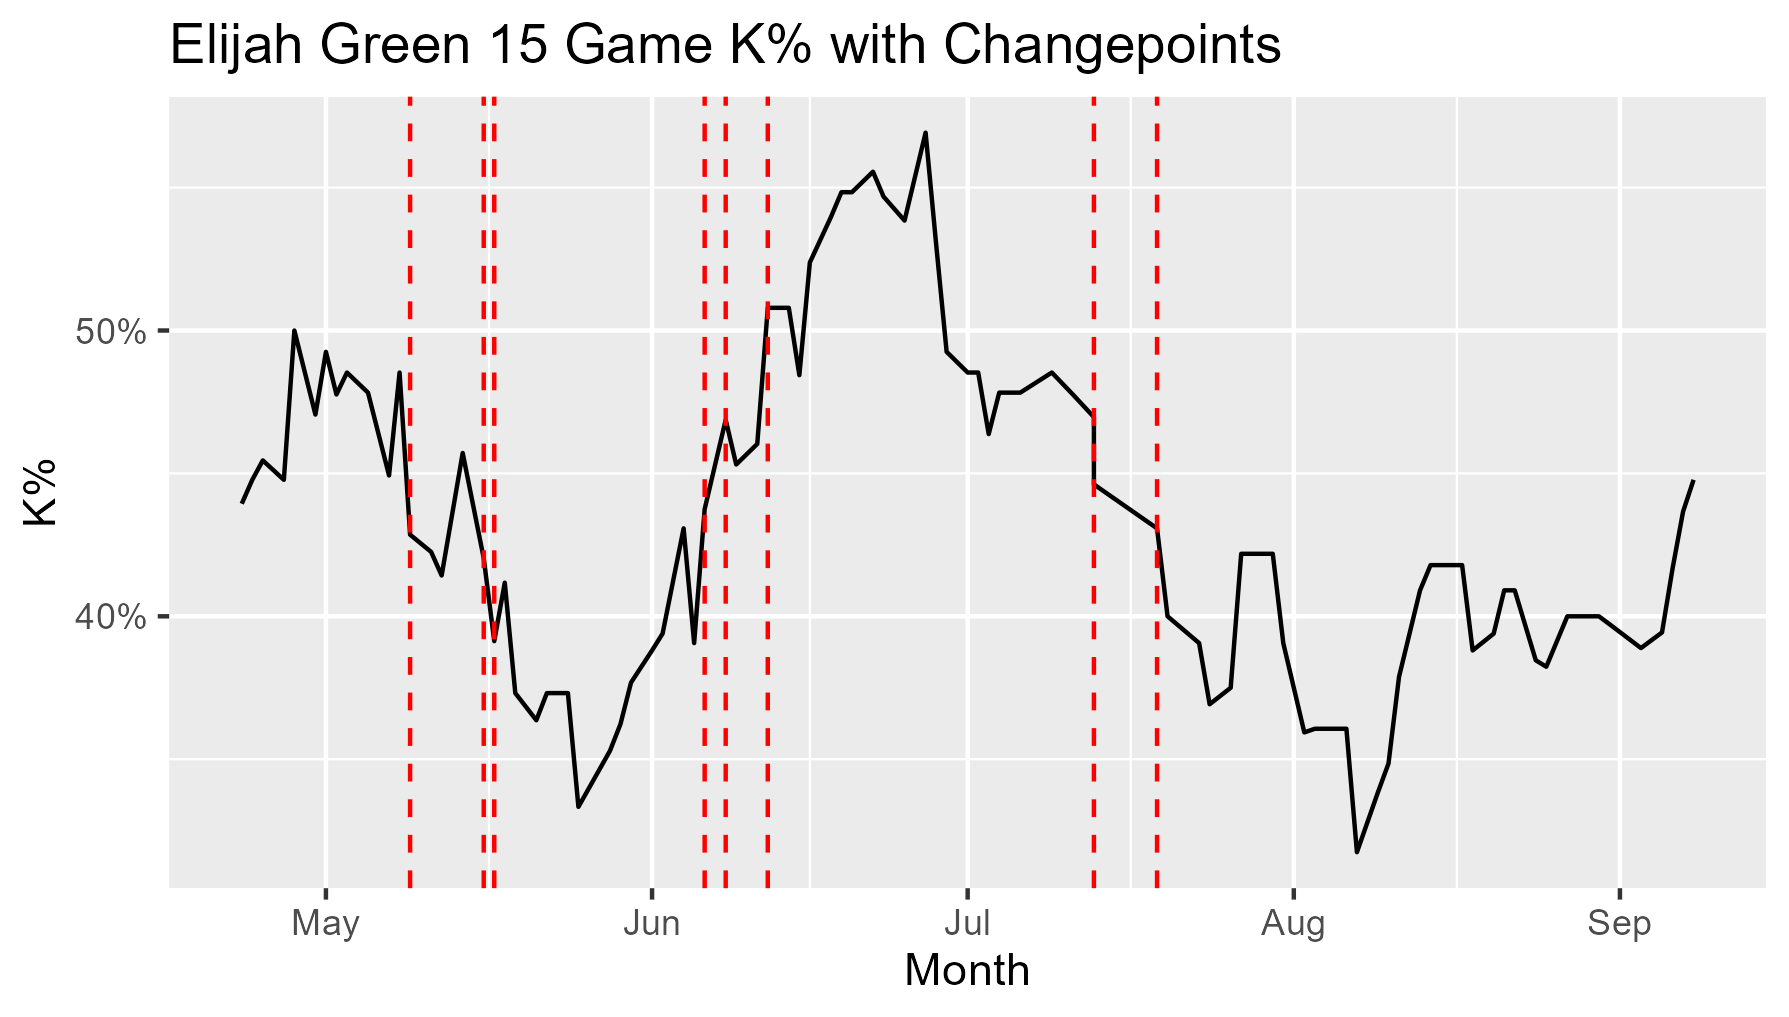
Elijah Green was the fifth overall pick in 2023, but has struggled mightily in A-ball, posting a .206/.308/.350 slash line with 360 strikeouts in the two years since getting drafted. He is still impressive physically, showing plus raw power and speed, but his bat to ball skills have been so poor it’s prevented a promotion to High-A. Here’s his rolling 15-game strikeout rate chart, with change points shown with the red dashed line.

You can see here that there have been four distinct period to his strikeout rate this year, with a couple smaller periods in between. He started off in a ~45% strikeout rate period, dropped briefly down to sub 40% near the end of May, start of Jun, before returning to a high 40%/low 50% period, and then in the last month of so he’s been in the low 40% once again. Nothing about this plot shows consistent improvement, or flashing at least middling strikeout rate potential, so I think it would be hard to justify a promotion at this stage.
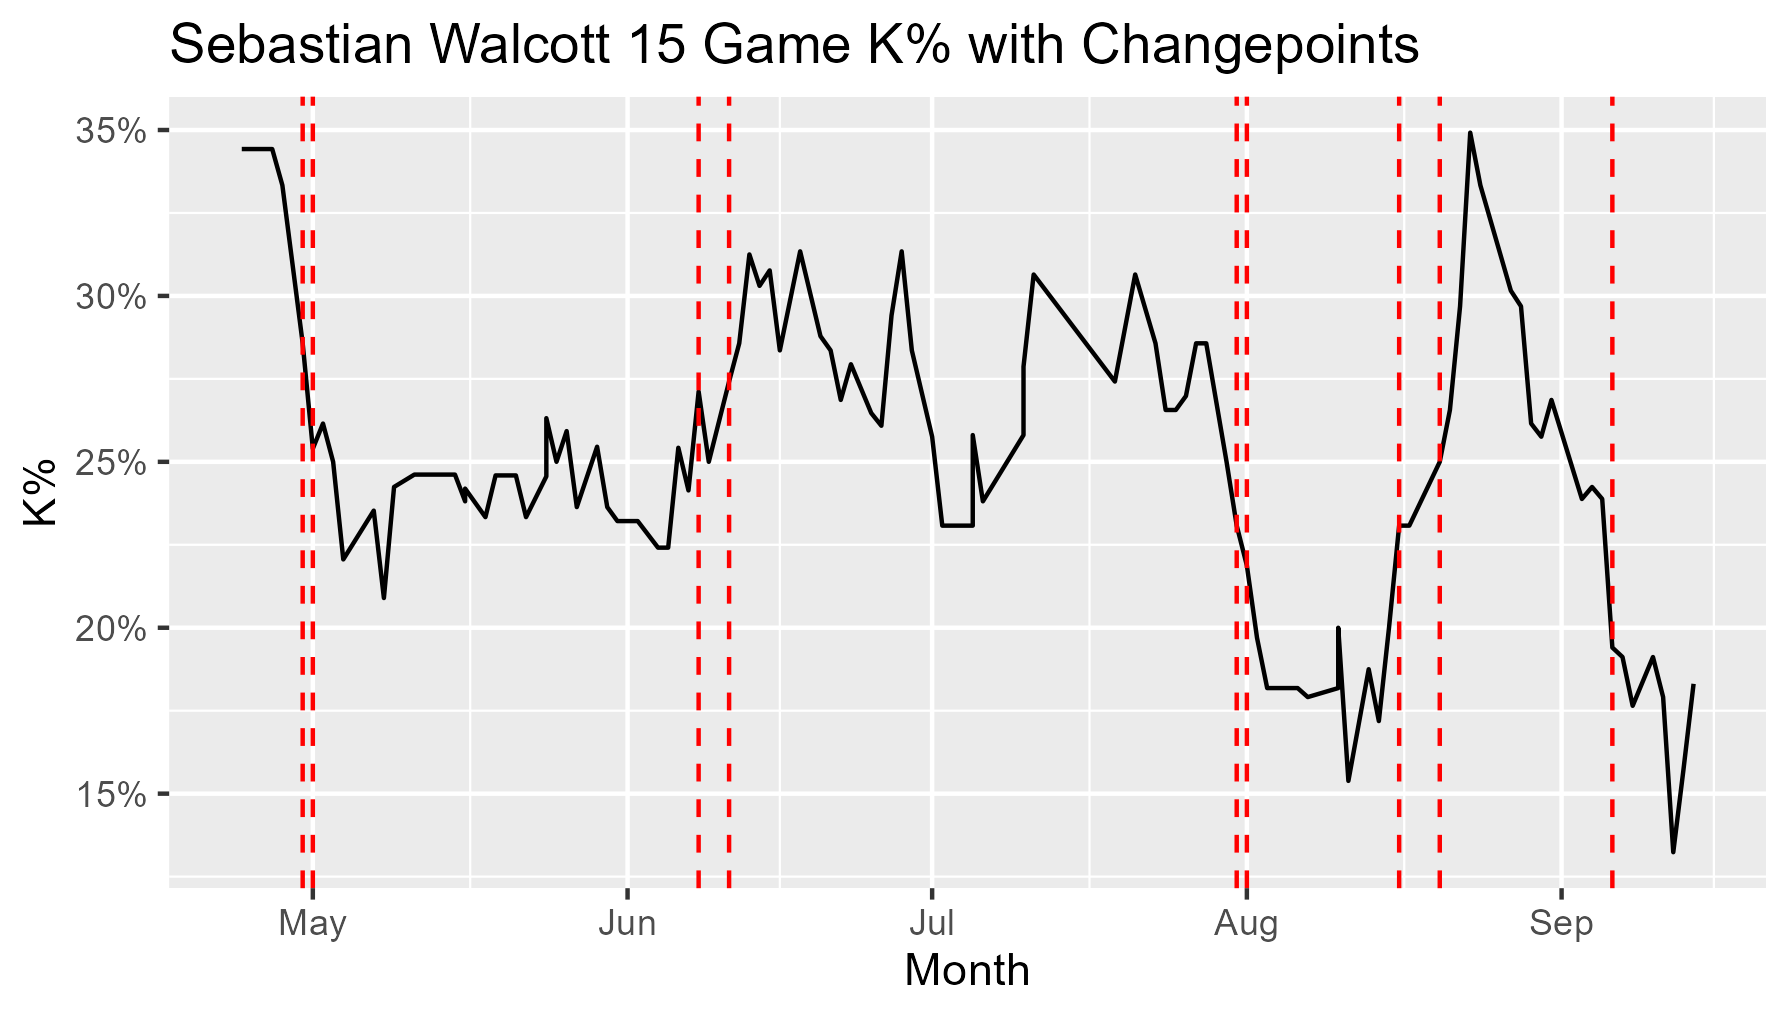
Sebastian Walcott is an 18-year-old playing in High-A. Walcott is a freak athlete, it’s difficult to find someone with his level of athleticism, power, and arm in the minors, and is similar in prospect stature to Fernando Tatis Jr/Elly De La Cruz/Oneil Cruz type. As you saw with all three of them, there were plenty of hit tool concerns, and that’s similar with Walcott. He’s spent all of this year in High-A, and being just 18 there’s no rush to promote him, but let’s look at his rolling strikeout rate chart and see where the changepoints are.

He started off pretty high but settled into a sub 25% strikeout rate up until June, until we saw a second period form where the strikeout rate we up to the higher 20% range, albeit with a pretty high variance. He was in this stage until the start of August, where he had a brief period in the below 20% strikeout rate before reverting back to his higher strikeout tendencies. This chart does show some flaws in the approach, there’s this false breakout in August that didn’t quite stick, but I do think it shows improvement over the course of the season that he hasn’t quite been able to stick to, but shows the potential of a lower strikeout rate. We’re at the end of the season now and so there’s no point in a promotion to Double-A, but I think he’s shown enough from a strikeout rate standpoint to earn a promotion to Double-A next year.
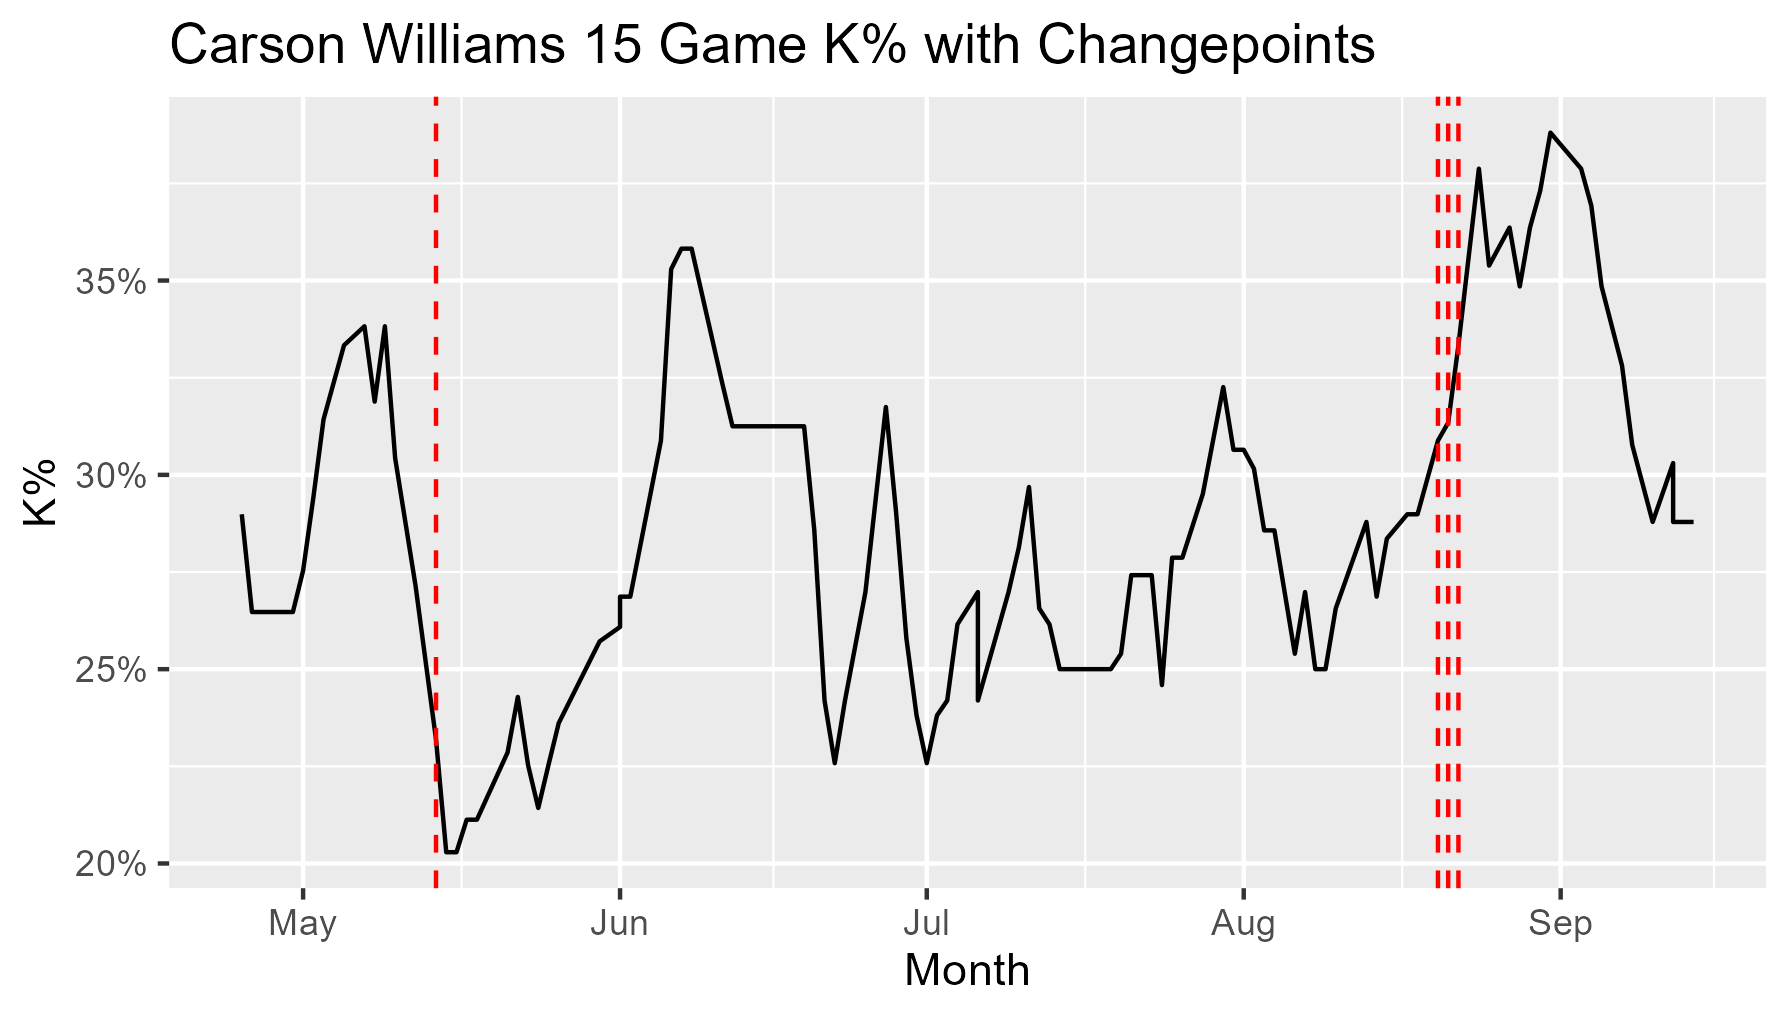
Sometimes, the algorithm doesn’t detect as many shifts and that’s what we’ve seen so far this year with Carson Williams.

Williams has been all over the strikeout rate spectrum this year, getting down to ~20% at times and then above 35% at other times. While it’s frustrating to see a guy be this streaky, it’s helpful to know there has been no change in the mean of the underlying time series. It’s hard to say whether or not Williams should be promoted; he hasn’t really shown much in the way of improving his strikeout rate over the course of the year, but he still has a 139 wRC+ with an .807 OPS and is barely 21 while doing all of this in Double-A. As our changepoint analysis showed though, he didn’t really make any changes to his strikeout ability this season, which is of some concern.
Hopefully this was a helpful article to learn what change point analysis is and how it can be applied to roster decisions at the minor league level. This isn’t foolproof, and just because he shows a period of improvement doesn’t guarantee that a player is ready for the next level, and won’t regress, but it’s nice to have a quantitative way to look at this. You can find a Shiny app for this here, which displays change points for all minor league hitters this year for a few key stats.
Original post: https://downonthefarm.substack.com/p/using-changepoint-analysis-for-prospect