There are many different equity ETFs that provide an alternative product to the standard equity indices (S&P 500, Russell 2000, etc.). Typically, these funds promise either higher absolute returns that the standard index, uncorrelated returns, or lower volatility, but they come with significantly higher expense ratios. It’s been written countless times, but most hedge funds underperform the market, which lends itself to a natural question, why not short them? Since I am skeptical that most active ETFs provide actual alpha, even after adjusting for volatility, I wanted to construct a trade where I go long the S&P 500, and short a basket of overpriced ETFs.
It’s not feasible to short every single active ETF, and so I decided to choose three representative ETFs that checked each box of signifiers that I thought would be overpriced and not provide alpha. The first requirement was that they had a high expense ratio. Many of these funds charge a high expense ratio because they trade unique products to provide “alternative” alpha, which I am skeptical works in most cases. I then looked for ETFs that were reaching for yield. Investors reach for yield in the bond market by purchasing low quality bonds with high coupons, which end up performing worse on a risk adjusted basis. I see analogies to this when investors look to buy high dividend stocks. Investors in these want equity like returns, on top of a large dividend payment, and I suspect that companies promising high dividends are worse quality companies on a risk adjusted basis. Paying high fees for this product doesn’t make sense to me, and so I wanted to find an ETF that covers this in the short basket. On a similar note, I also looked for a covered call strategy ETF, for similar reasons to the dividend ETF. Investors are looking to “generate income” with these strategies, which is a buzzword red flag for me, and I wanted to short something like this. Lastly, I looked for an ETF that touted themselves as multi-strategy/provide uncorrelated returns, because even on a risk adjusted basis I again am skeptical that many of these provide material outperformance. I ended up choosing KBWD (expense ratio of 2.02%, high dividend yield), XYLD (0.60%, covered call), MDIVD (0.68%, multi-strategy, reaching for yield) as my three ETFs to short, but there are tons of these types of ETFs to test out.
Before going into the strategy results, I wanted to list some prior expectations of the trade. For one, while I think the ETFs will perform worse than the S&P 500, on a risk adjusted basis, it would only be by 4-6%. As a result, from a raw percentage standpoint, this strategy would not outperform the S&P 500, but it should have far lower volatility. The goal would be to outperform on a risk adjusted basis. The second is that since these ETFs are smaller, it’s harder to leverage the trade, and thus makes it a low-capacity trade. I don’t have a great sense for how much money could be allocated to the trade, but it’s likely not a trade a large asset manager would be interested in (which provides opportunities for smaller players).
Moving on to the strategy, I wanted to make sure that the trade was volatility neutral in order to properly extract the negative alpha from the ETFs. Without adjusting for the risk levels of each ETF, we could be attributing outer/under performance of the strategy to non-alpha related factors. Another key point here is that I’m not factoring in transactions costs or cost to borrow stock for short. This means that the returns here will be overstated, but I wanted to see if the most optimistic version of the strategy would work first before implementing the hard stuff.
I calculated the log returns and the 20-day volatility of each ETF. Then, within the basket of ETFs I wanted to short, I weighed by volatility so each ETF would have an equal vol contribution. Then I weighed the basket by vol against SPY, so that SPY and the short basket had the same volatility.
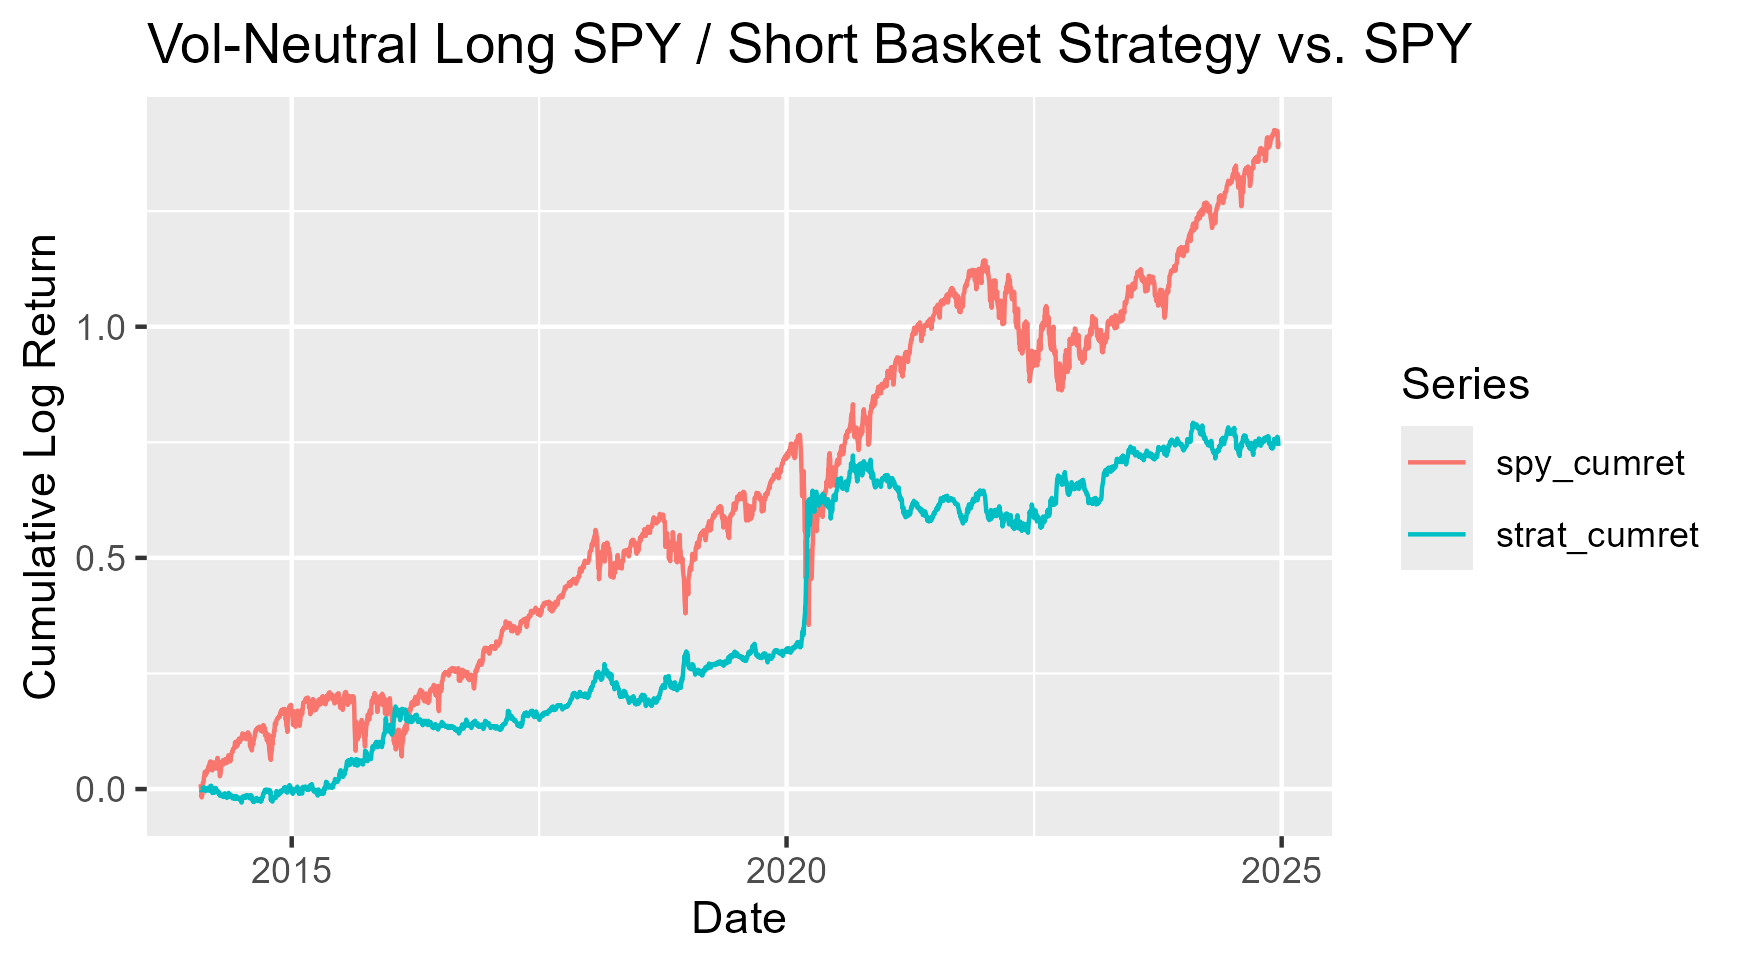
Let’s look at the results graphically:

As you can see, from a raw performance standpoint, the strategy performs far worse than the S&P500. It did outperform during the initial Covid shock, but aside from that the strategy is relatively flat. This is what I expected before running the test, but let’s compare Sharpe ratios:
| Strategy |
Sharpe |
| SPY |
0.75 |
| LS Strategy |
0.70 |
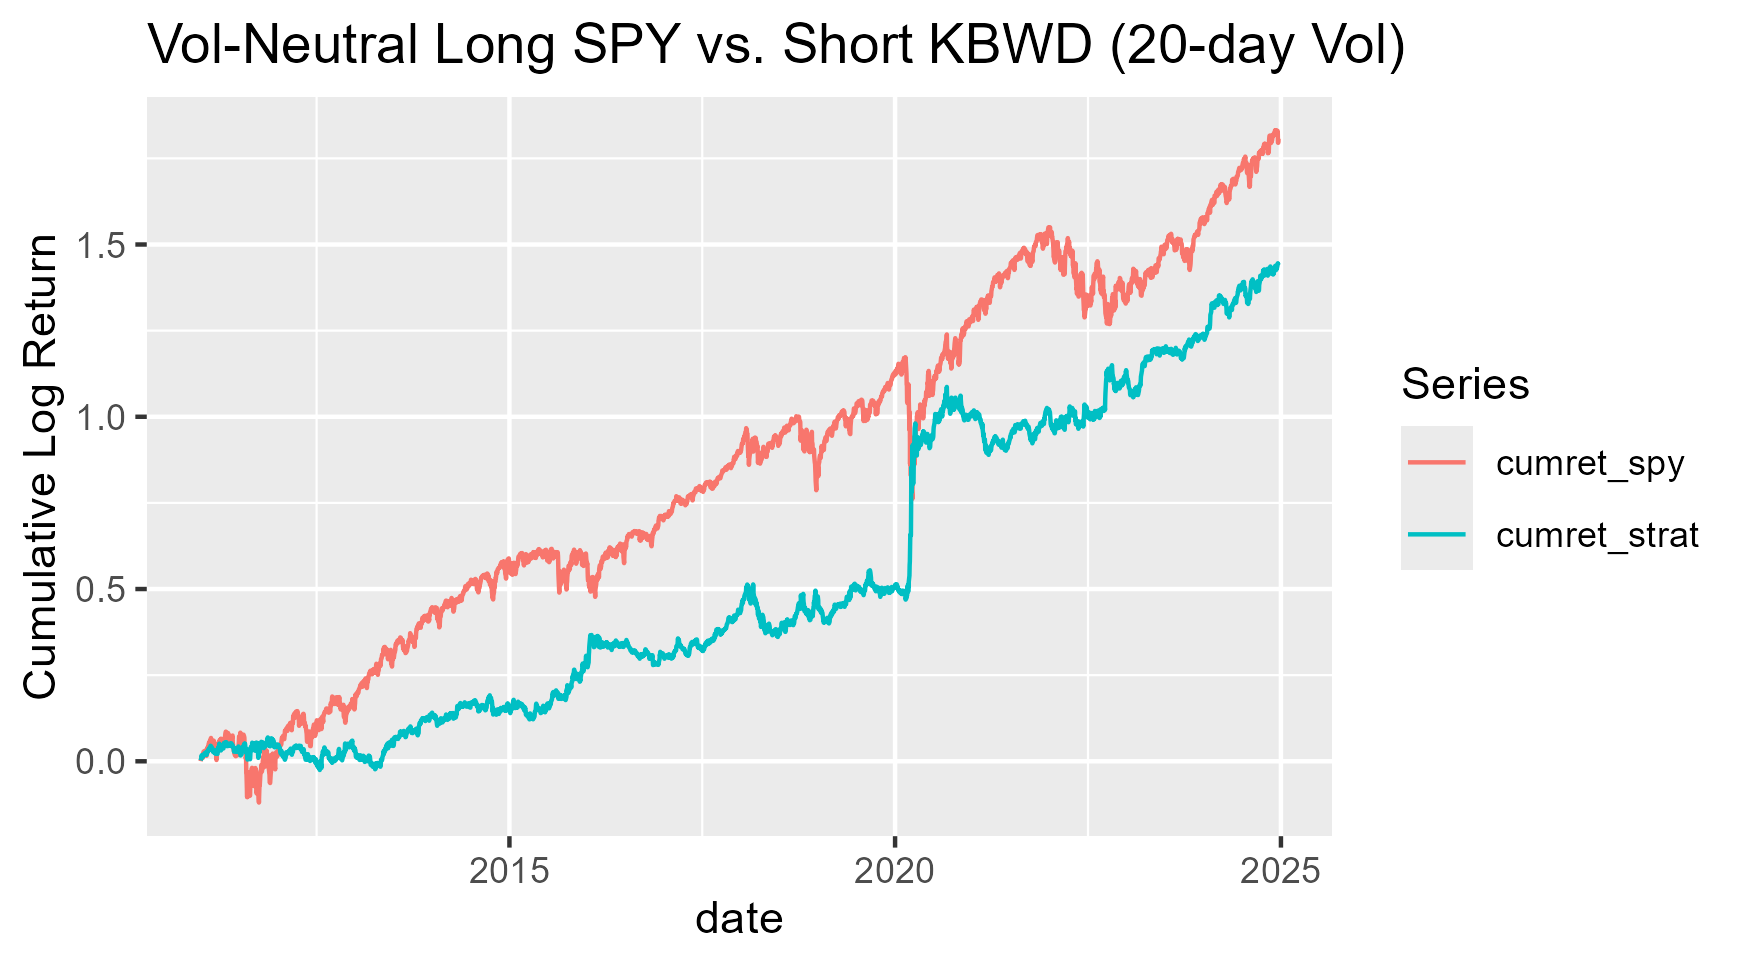
Unfortunately, the strategy underperforms the S&P 500 from a Sharpe ratio perspective as well. This was pretty surprising to me, given that the 3 ETFs that we are shorting all have Sharpe ratios far worse than the S&P500. Lastly, I tested the strategy by going long SPY and short the worst ETF (KBWD). This resulted in a trade with a Sharpe ratio ~0.86, compared to the 0.75 Sharpe ratio for SPY, which is promising and shows that ETF selection is key.

| Strategy |
Sharpe |
| SPY |
0.75 |
| SPY v KBWD |
0.86 |
In summary, I built a strategy based on the idea that most active ETFs underperform the market, even after adjusting for volatility. I thought that I could then short the ETFs that I believed would underperform, and go long SPY, and have higher risk adjusted returns than the SPY by weighing the long and short side by volatility. Unfortunately, the basket of ETFs that I chose didn’t outperform SPY on a volatility basis, though for the ETF with the lowest individual Sharpe ratio, KBWD, going long SPY and short KBWD did outperform SPY. There is evidence here that the strategy performs well during economic downturns, as evidenced by the jump the strategy saw during the beginning of COVID. This could make this strategy worthwile to implement as a “tail-risk” hedge that complements an all equity portfolio. In a future post, I would like to update this strategy by thinking about correlation (high correlation to SPY being better, since if it’s highly correlated to SPY but has slightly worse returns and higher fees, there should be alpha in going long the cheaper and slighter better ETF and shorting the more expensive and slightly worse ETF) as well as add in transaction costs and have more realistic trading timelines.
Code: INSERT CODE HERE